ISEAL has produced a package of tools and guidance on the power of polygon data and how sustainability systems can collect it.
Polygon data can provide a lot of value to sustainability systems, if collected and used effectively. Key unlockable benefits include improved operational efficiency, risk management, performance and impact communication, and the ability to collaborate more effectively.
What is polygon data?
Polygon data is a form of location data used to represent geographic areas. It is defined by a series of points, or coordinates, which are connected through a digital dot-to-dot to form a shape. Sustainability systems can use polygon data to map certified activity areas and, through a geographic information system (GIS), analyse and manipulate the data to gain useful insights.
Its value to the ISEAL community was first recognised through our Certification Atlas project. Since then, we have been working with members to develop materials that explain and illustrate its importance and provide support for sustainability systems to collect it.
Ways to apply polygon data
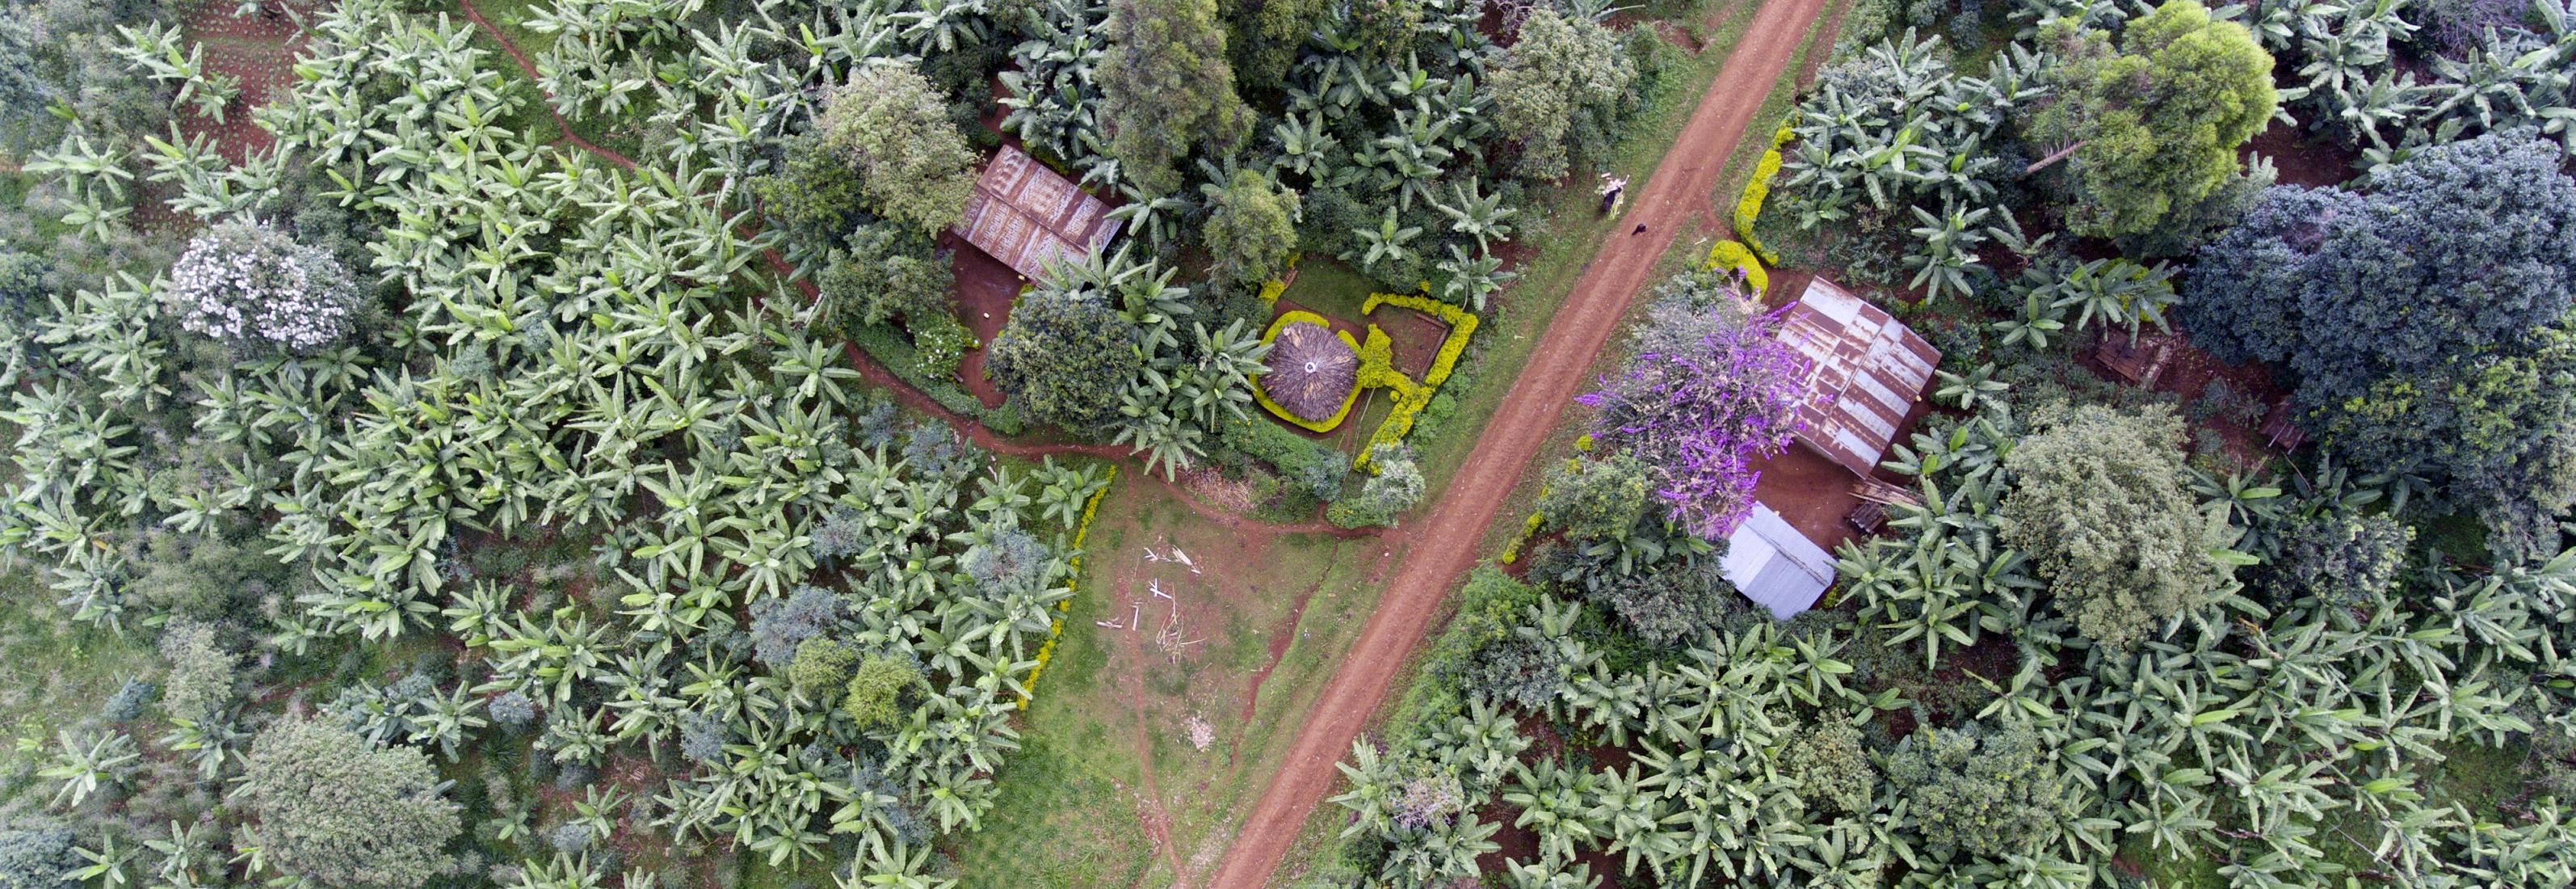
Polygons that map certified activities can be used in several ways. They are particularly useful for navigation to and around certified activity areas. This is valuable for any visiting non-certificate holders; especially auditors.
They also help to map and visualise information associated with the certificates themselves, like compliance or performance data. This is vital for exploring differences across an area.
And, most notably, they can be compared with other layers of spatial information, such as deforestation or poverty rates. This helps users to understand how certification activities might be interacting with sustainability issues or other spatial features.
Using polygon data in any of these combinations can be very powerful for decision making and communication. This helps to direct on the ground activities such as audits and programmes, and contributes to improving transparency with supply chain actors.
Improving accuracy
Polygon data can also provide a more accurate measure of certified activity area size, versus self-reported area information.
Accurately measuring area size is incredibly important for calculating performance indicators such as yields, greenhouse gas emissions and input efficiencies like agrochemical application and water use (in agriculture).
These types of performance indicators, when calculated correctly, are powerful for informing decisions and exploring and communicating impact.
Polygon data collection approaches
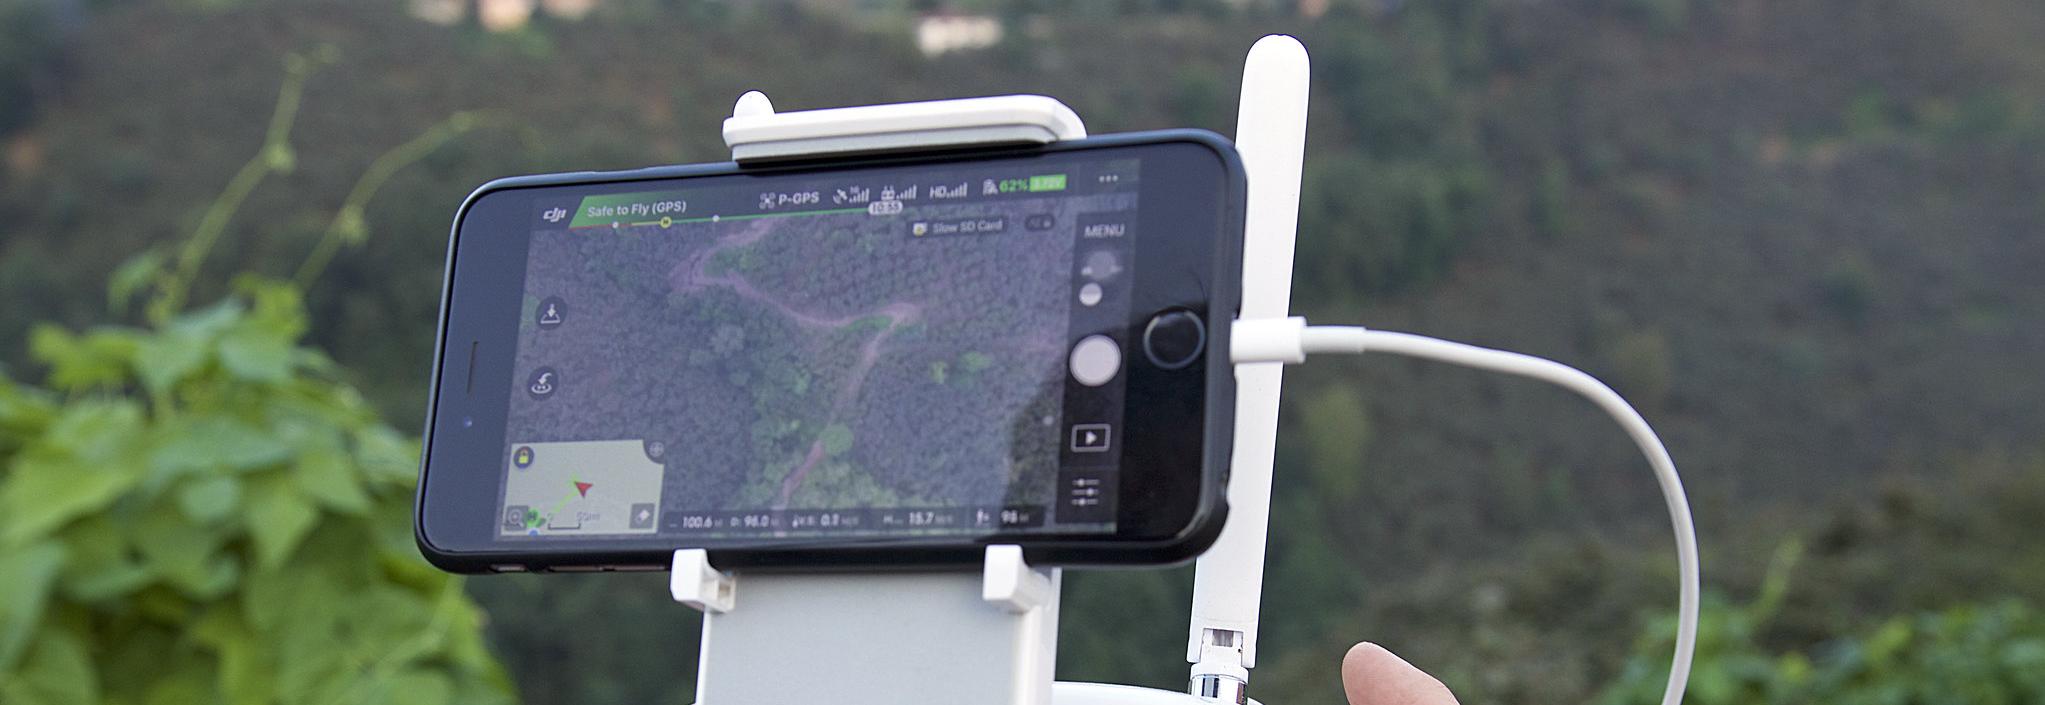
Polygon data is collected in a variety of ways. ISEAL has identified four options for systems to consider employing: leveraging existing data, using mapping tools to draw polygons, walking certified activity area boundaries with GPS recording devices, and considering newer technologies such as drones and artificial intelligence (AI).
With any of these approaches, organisations will need consider and choose from several technologies. Both the approach and technology applicable will vary based on local considerations and conditions, as well as the capacity of the implementing system.
None of these options are mutually exclusive however, and different approaches may be needed to fill data gaps and help validate collected polygons.
Supplementary resources
More information on the power of polygon data
For community members:
• Read our summary document for decision makers and overview webinar (webinar requires login)
• Access our comprehensive guidance document on collecting polygon data and complementary video training series (training requires login)
Contact adam@isealalliance.org for more information.
This work was funded by the German Federal Ministry for Economic Cooperation and Development (BMZ) through GIZ.